Air pollution
Why should we care?
The increased air pollution with particulate matter and ozone is frequently result of unfavourable geographical location (basin), which leads to unfavourable winter temperature inversion, and transfer of pollutants from the Po Valley in Italy, which has an impact on elevated ozone concentrations in the Primorska region, especially in the summer. Pollution is reflected in human health as the state of ecosystems.
Air pollution plays important role in providing adequate quality of life.
In Slovenia the issue of air pollution is largely linked to particles (PM10) and, in the summer, to ozone. In addition, in the degraded area of the Mežica Valley heightened concentrations of lead occasionally occur. Measurements of PM10 indicate an occasional exceedance of limit values across the whole of Slovenia, and especially in the inner areas, where long-lasting temperature inversions occur in winter. Analysis of PM10 sources indicates that the cause of this pollution is largely road transport, especially in urban centres with heavy traffic – the Ljubljana Basin – and in poorly ventilated basins, emissions from heating appliances and industrial sources – Zasavje and Celje basins. A major contribution to the ozone pollution, which is more pronounced in the coastal Primorska region, comes long-distance from the Po Valley in Italy.
In addition to the negative impact that polluted air has on human health, damage to ecosystems, especially around the Šoštanj and Trbovlje thermal power facilities has been noted. Epiphytic lichen cover indicates better preservation of forests at higher altitudes. Biomonitoring of mosses points to a slightly higher value of metals and nitrogen in the areas around the bigger towns and cities as well as industrial and thermal energy plants. Increased values in western Slovenia can be ascribed to long-distance transportation, and in the northeast of the country mainly to traffic and agriculture. The consequences of higher concentrations of ozone, AOT40, can be seen largely in reduced crop yields, reduced growth of perennials and production of seeds from annuals, and in poorer growth of forest trees.
The aim is for Slovenia to improve the quality of ambient air in future by seeking more effective solutions, especially in the transport sector, and by devoting greater attention to education, notification and awareness-raising.
What are the state and impacts?
Ambient air quality is satisfactory. Despite the fact that the pollution with particulate matter and ozone decreases, the proportion of children taken to hospital due to respiratory disease and asthma is increasing.
Increased air pollution affects human health, but also causes damage to ecosystems.
Concentrations of PM10, especially in some parts of urban areas, exceed the daily limit concentrations of 50 ug/m3 on more than 35 days a year. Identifying the sources of particulates clearly shows that the major contributors are (road) transport, transboundary air pollution and resuspension, and in the winter months road salting, individual heating appliances and unfavourable weather conditions.
PM10 concentrations are generally higher in winter than in summer, in the interior of Slovenia from 70 % to 100 %, and in Primorska up to 20 %. Pollution from PM10 made 2003 an especially troublesome year, mainly owing to the long drought and low rainfall. At that time, as much as 90 % of the urban population of Slovenia was exposed to more than 100 days daily PM10 concentrations above the limit, Maribor – 185 days; Celje – 146 days; Zagorje – 140 days; and Ljubljana – 116 days. Since 2003, daily concentrations have fallen, but limit values are still exceeded from time to time. Particular mention should be made of the Zasavje region, a poorly ventilated basin with the highest number of excessive readings a year – in 2008 more than 100. This results from transport and industrial sources as well as the unfavourable basin geography that causes unfavourable temperature inversions, particularly in winter (ZR08, in Slovene only).
Figure 1: State of air pollution from PM10 particles 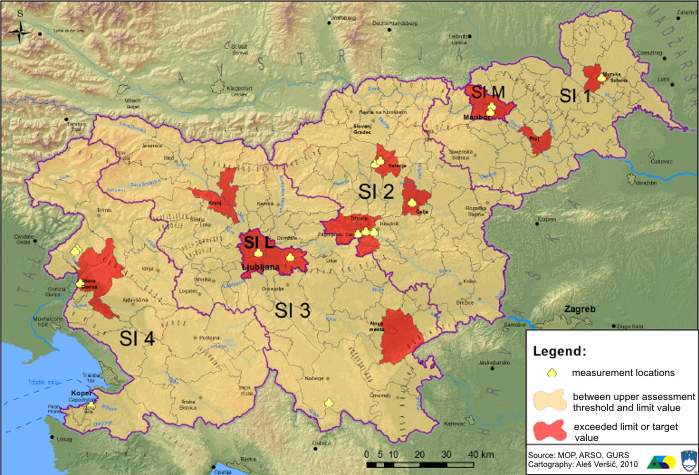
Source: Estimate of air pollution, 2010
Figure 2: Number of days exceeding limit concentrations of PM10 – 50 µg/m3 which may be exceeded at most 35 times in a calendar year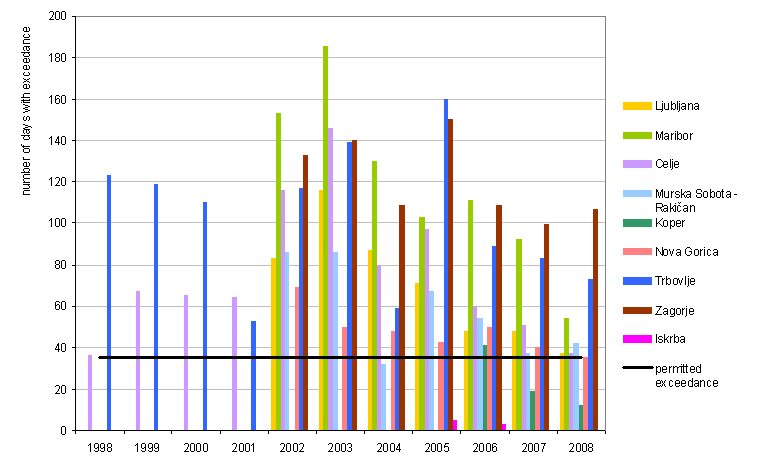
Source: Database of automatic readings from the national network for monitoring air quality (DMKZ), Environmental Agency of the Republic of Slovenia, 2009, (Ref: Environmental Indicators in Slovenia, ZR08)
Risk to human health from air pollution
In the upper Mežica Valley, which is regarded as a degraded area owing to the consequences of the extraction and processing of lead and zinc ores between 1424 and 1994, there are still slightly higher concentrations of lead found occasionally in the ambient air despite ecological rehabilitation. Excessive lead contamination means an increased risk to human health, especially children, and more than a third aged three years have been found to have heightened concentrations of lead in the blood. In order to reduce the amounts of heavy metals in the upper Mežica Valley, the exploitation of sand and fine-grain sand from landfills would need to be banned, halting the transfer of heavy metals to the already rehabilitated environment (ARSO, 2008).
Air pollution with particulate matter PM10 can progress cardiovascular diseases and respiratory diseases, especially with children as more vulnerable social group. By the data of the Institute of Public Health of the Republic of Slovenia, children (0-15 years old) in Slovenia are exposed to concentrations of 30–40 µg PM10/m3, which is above the level recommended by the World Health Organization (20 µg PM10/m3). Admissions to hospital of children (0-15 years old) diagnosed with respiratory diseases, which can be a result of increased pollution with particulate matter PM10 in outdoor air, accounts for 15% of all admissions (ZD03).
Since PM10 particles may cause the development or exacerbation of asthmatic diseases, Slovenia is also monitoring the proportion of hospital admissions of children aged 0-14 years for asthma. In 2006, children 0-4 years accounted for just over 0.9 % of all admissions for asthma, children aged 5-9 years 2 % and children aged 10-14 years 1.2% (ZD02).
Figure 3: Exposure of children (0–15 years old) to various PM10 concentration levels in outdoor air (the recommended World Health Organization annual PM10 value is 20 µg/m3; the EU has set the limit at 40 µg/m3)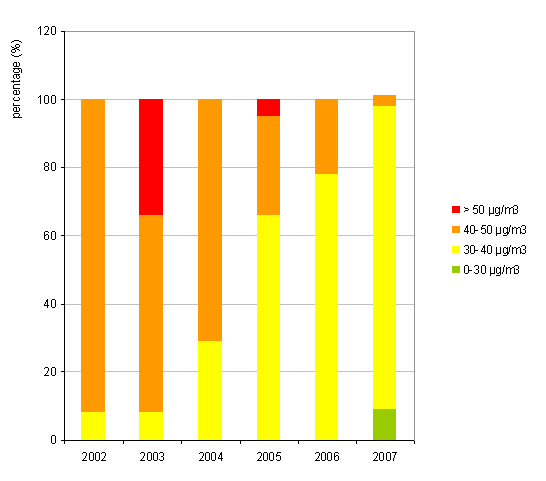
Source: Database of the Institute of Public Health of the Republic of Slovenia, 2009; The National Automatic Measurement Air Quality Network Database, Environment Agency of the Republic of Slovenia, 2009. (Ref: Environmental Indicators in Slovenia, ZD03)
Figure 4: Children aged 0-14 years as a proportion of hospital admissions for asthma 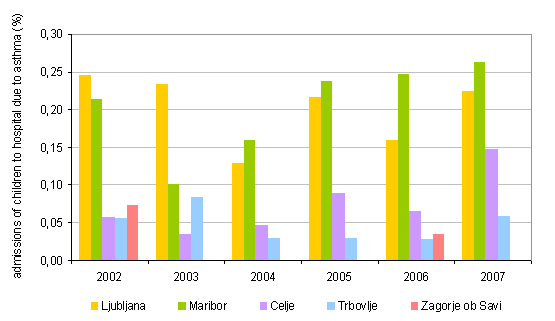
Source: Database of the Institute of Public Health of the Republic of Slovenia, 2009. (Ref: Environmental Indicators in Slovenia, ZD02)
Ozone air pollution
In addition to higher PM10 concentrations, there are occasional higher concentrations of ozone across Slovenia. These concentrations exceed both the target and long-term guideline values at all measuring locations, except for those exposed to emissions of nitrogen oxides (NOx) from traffic. Exceeded values were particularly pronounced in 2003, and this was exacerbated by the especially hot summer, with a great amount of solar radiation. The greatest number of times readings are in excess of the cautionary values for human health, 180 µg ozona/m3, is in Primorska in the summer, largely long-distance transportation from the Italy’s Po Valley, and at measuring stations at higher altitudes (ZR07).
The consequences of higher concentrations of ozone can be seen largely in reduced crop yields, reduced growth of perennials and production of seeds from annuals, and in poorer growth of forest trees. (ZD06)
Figure 5: Number of days with exceeded target values for ozone in Slovenian locations when the highest average 8-hour sliding value is greater than 120 μg/m3, the annual limit value is 25 days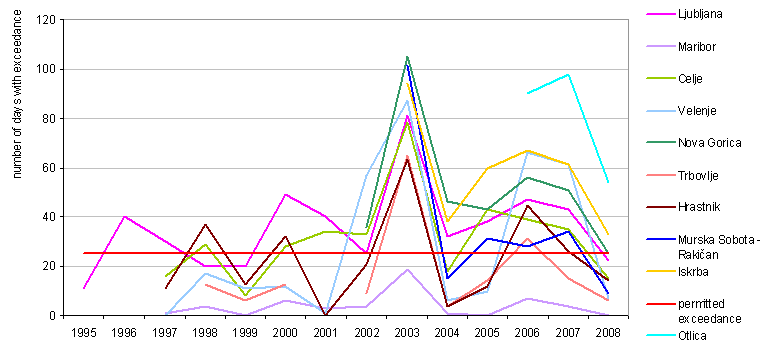
Source: Database of automatic readings from the national network for monitoring air quality (DMKZ), Environmental Agency of the Republic of Slovenia, 2008, (Ref: Environmental Indicators in Slovenia, ZR07)
Figure 6: Ozone pollution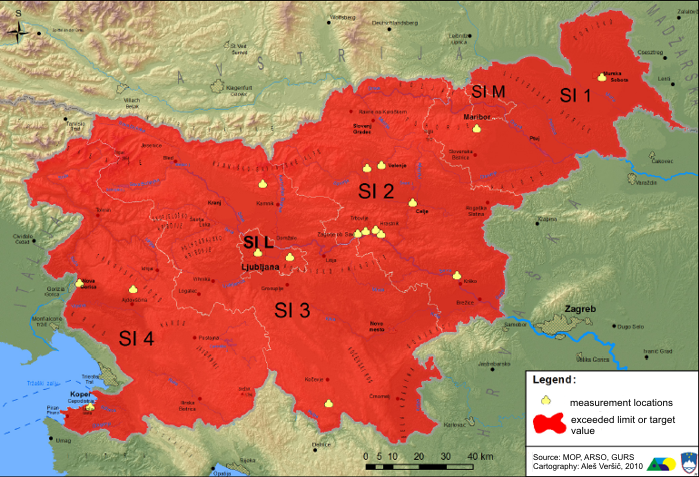
Source: Estimate of air pollution, 2010
Critical input of air pollutants
The sensitivity of ecosystems to ambient air pollution can be seen in the critical input of pollutants resulting from natural features – pedoclimatic factors, forest structure – and from certain such anthropogenic influences as forest management. The effects of pollutants are monitored in forest ecosystems in terms of acidification – sulphur dioxide (SO2) and NOx – and eutrophication – NOx and ammonium (NH4). The results show that, in comparison with other areas of Europe, Slovenia has very few instances of excessive critical inputs for acidic pollutants, but that the country is susceptible to eutrophication. In soil acidification a link has been observed between the bedrock and calculated critical inputs, as on carbonates the values are so high that they are irrelevant since such deposits tend to cause direct damage to plants. Thus only non-carbonate areas, mainly in the east of the country, are assessed. Critical inputs of nitrogen as a eutrophication factor are lowest in the area of the gravelly terraces of major rivers. Excessive amounts appear in a very scattered form around Slovenia, but to a very small extent on the surface. Calculations show that the values are exceeded on less than 1 % of the forest area of Slovenia.
Figure 7: Excessive burdens on forest ecosystems of nitrogen, causing eutrophication (A) and with nitrogen compounds and sulphur, causing acidification (B)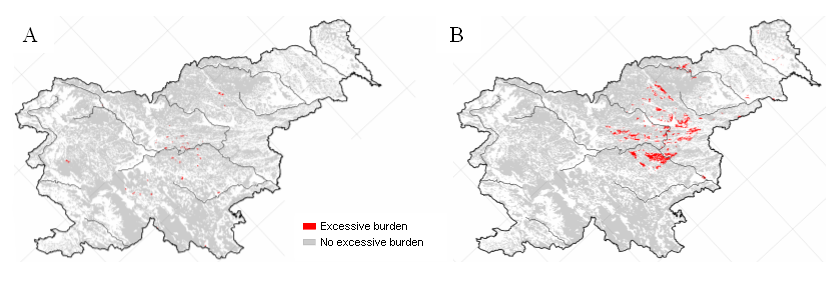
Source: Biotechnical Faculty, University of Ljubljana, 2009
Monitoring the air pollution using epiphytic lichen
The results of monitoring the state of forests using epiphytic lichen point to the better preservation and cleaner air in forests at higher altitudes in the Slovenian Alps – the Julian Alps, Karavanke, Kamnik-Savinja Alps and the central Pohorje area – and partly also in the Slovenian Dinaric mountain range. In central and eastern Slovenia, the growth of lichens is poorer owing to local air pollution from thermal power plants, industry, transport and agriculture. Poorer growth in the western part of the Julian Alps and at higher altitudes in the Dinaric range is, in all probability, a consequence of long-distance pollution. There is also a noted absence of bushy lichens in the majority of Slovenia, and sparse cover with leafy lichens. All three growing types of algal organisms and better growth have been recorded only in mountain forests that are remote from sources of air pollution and also have a more suitable microclimate and stand conditions for epiphytic lichens to thrive. In other words, local variations are the consequence of local climate and stand conditions. (ZD07)
Figure 8: Epiphytic lichen cover by category, 2007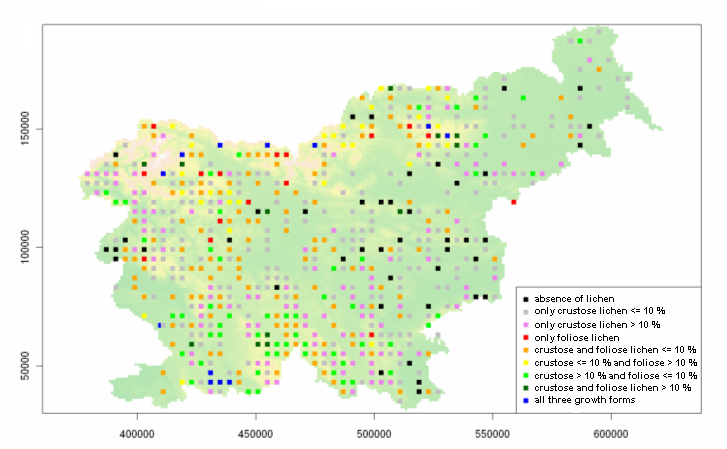
Source: Lichen Census 2007, Slovenian Forestry Institute (Ref: Environmental Indicators in Slovenia, ZD07)
Monitoring the air pollution using moss
Monitoring using moss indicates high concentrations of metals and nitrogen in the areas around larger towns, cities and industrial and thermal energy centres. Increased values in western Slovenia can be ascribed to long-distance transportation, and in the northeast of the country mainly to traffic and agriculture. Relative to other European countries, Slovenia ranks among those that are moderately polluted, with slightly higher concentrations of cadmium, mercury and lead, although these are still lower than the concentrations in other Eastern European countries.
Figure 9: Nitrogen concentrations (%), 2006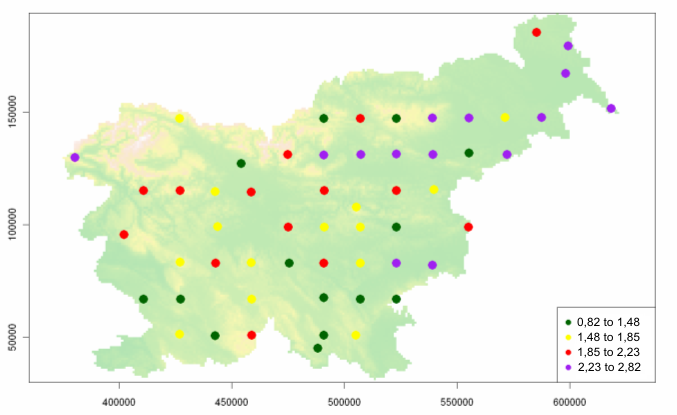
Source: Jožef Stefan Institute, 2009
What are the related drivers and pressures?
The largest sources of outdoor air pollution are energy and transport sectors. The cause of this is mainly (too) slow restructuring of the Slovenian economy and unsustainable consumption patterns, which are heavily influencing the increase of final energy consumptions.
Air pollution is largely dependent on the speed of economic development and pressures caused by transport and energy.
The slow restructuring of the Slovenian economy and unsustainable consumer patterns are putting great pressure on the air in terms of pollution, especially from the transport and energy sectors, which are the main sources of air pollution. The last ten years have seen the relatively slow restructuring towards the strengthening and growth of services, together with a rapid decline in the importance of farming and a moderate decline in the share of industry in Slovenia’s economy. In the period 1995–2005, the proportion of services increased to 63.2 % of total value added. The reduced share of industry – 27.4 % in 2005 – was relatively smaller. Among the EU countries, Slovenia has a high proportion of manufacturing activities – 22.1 % – and within that the energy-intensive sectors – chemicals, non-metallurgical, metallurgical and paper – have a significant share. Particularly prominent are metal production with 4.4 % and the chemical industry contributing 3.1 %, ranking Slovenia, at 9.9 %, second amongst EU countries. In 2000–2008, Slovenia saw a reduction of 3.7 percentage points in the proportion of manufacturing and 0.4 percentage points in energy-intensive activities, indicating that in this period there were no major structural shifts in Slovenian industry (IMAD, 2009).
A consequence of the existing economic structure and non-sustainable consumer patterns is reflected in the increased end-use of energy. This rose from 1992 to 2008, mainly from growth in transport and broad consumption, but fell in industry. The high growth in energy end-use in transport is a consequence of the growing level of motorisation, the increasing number of kilometres driven per private vehicle, and, following entry into the EU, the pronounced growth of transit traffic. In 2007, with 37 % of energy end-use, the transport sector became the largest consumer of energy, and in 2008 it consolidated this position with a share of over 40 % (EN10). The reduction in the consumption of energy in industry was aided by lower energy consumption in the production of metals, fibres and paper, the result of changes to the quality system and reduced output. The reduced intensiveness continued in 2008, mainly through the adaptation of production to the Integrated Pollution Prevention Control (IPPC) Directive, causing the production of primary aluminium to fall by a quarter (IMAD, 2009).
Figure 10: Average annual growth of energy end-use by sector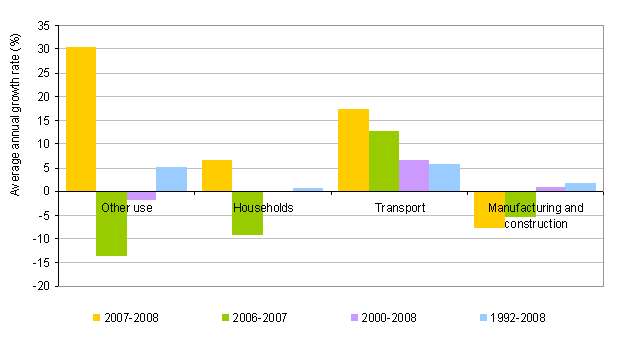
Source: Statistical Office of the Republic of Slovenia, 2009; Jožef Stefan Institute, 2009. (Ref: Environmental Indicators in Slovenia, EN10)
Emissions of air pollutants from energy and transport sector
Despite the increased energy consumption, emissions from the energy and transport sectors have fallen. In 2007 emissions of NOx and non-methane volatile organic compounds (NMVOC) fell below the target values, while SO2 and ammonia (NH3) emissions remained below the target values for 2010. This contributed to a reduction in the emissions of substances that cause acidification, ozone precursors and solid particles. NOx is the only pollutant that is present in all three groups in significant proportions. The main source of NOx emissions is transport, followed by electricity and heat generation (EN09,PR08).
Emissions of gases causing acidification and eutrophication fell in 1990–2007 by 73 %, due mainly to reduced emissions of SO2 (ZR09).
Figure 11: Index of the trends of total emissions of pollutants from the energy sector – emissions of SO2, NOx, NMVOC, NH3 and PM10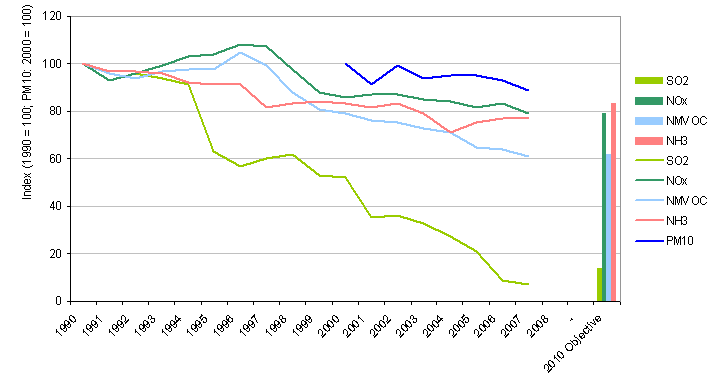
Source: Environmental Agency of the Republic of Slovenia, 2009. (Ref: Environmental Indicators in Slovenia, EN09)
Figure 12: Index of trends for emissions of air pollutants from transport – emissions of substances that cause acidification, ozone precursors and solid particles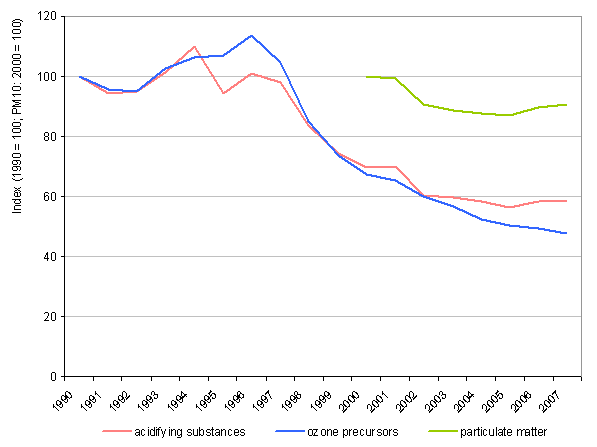
Source: Environmental Agency of the Republic of Slovenia, 2009. (Ref: Environmental Indicators in Slovenia, PR08)
Emissions of acidifying and eutrophying substances
By 2006, SO2 emissions had been reduced by 92 % relative to 1980. The reduction is chiefly a result of lower emissions from thermal power stations – start-up of a desulphurisation unit at block 4 of Šoštanj power station, and start-up of a desulphurisation unit at Trbovlje and start-up of a desulphurisation unit on block 5 of Šoštanj in 2000 – the introduction of liquid fuels with lower sulphur content in 1995, the use of higher-quality fuels and implementation of the LCP, in 2002, and IPCC, 2004, directives. In 2006, emissions of SO2 were 33 % lower than the target value (ZR01).
Annual emissions of NOx in Slovenia fell by almost 20 % up to 2007 relative to 1987. The fall is a result of the increased proportion of vehicles with catalytic converters. In 2007, NOx emissions were 1 % lower than the target value (ZR02).
Annual emissions of NH3 fell by 36.5 % up to 2006 relative to 1990. The reduction is a result of a reduction in cattle numbers. In 2006 emissions of NH3 were 7 % below the envisaged target value. In 2007 total NH3 emissions in Slovenia amounted to 18.5 kt. The major share, 17.7 kt, comes from the agriculture sector, accounting for 95.7 % (ZR03).
Figure 13: Trends of emissions of gases causing acidification and eutrophication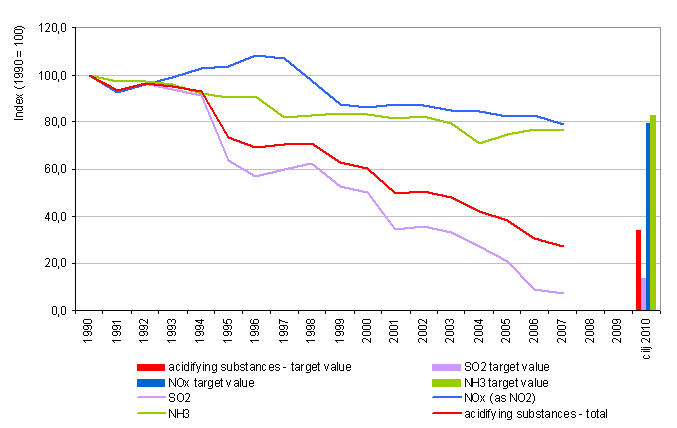
Source: Environmental Agency of the Republic of Slovenia, 2009. (Ref: Environmental Indicators in Slovenia, ZR09)
Figure 14: Structure of the emissions of gases causing acidification and eutrophication by source, 2007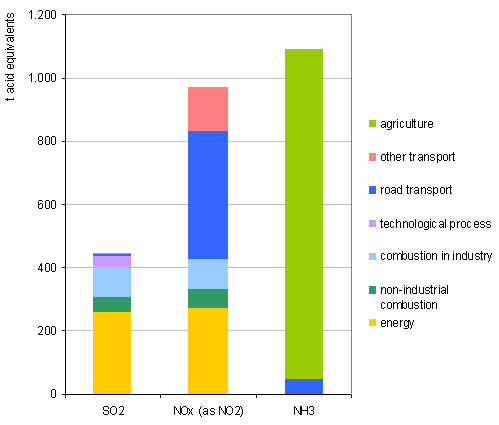
Source: Environmental Agency of the Republic of Slovenia, 2009. (Ref: Environmental Indicators in Slovenia, ZR09)
Emissions of ozone precursors
Emissions of ozone precursors fell between 1990 and 2007 by 34 %, mainly as a result of increased use of vehicles with catalytic converters and, to a lesser extent, from the increased use of diesel vehicles (ZR10).
Up to 2007, annual emissions of NMVOC fell by 39 % compared to 1990. The reduction may be ascribed to lower emissions from motor vehicles owing to the increased number of vehicles fitted with catalytic converters, and implementation of two regulations on VOC emissions in the air. In 2007, NMVOC emissions were 1.7 % lower than the target value (ZR04).
Figure 15: Emission trends of ozone precursors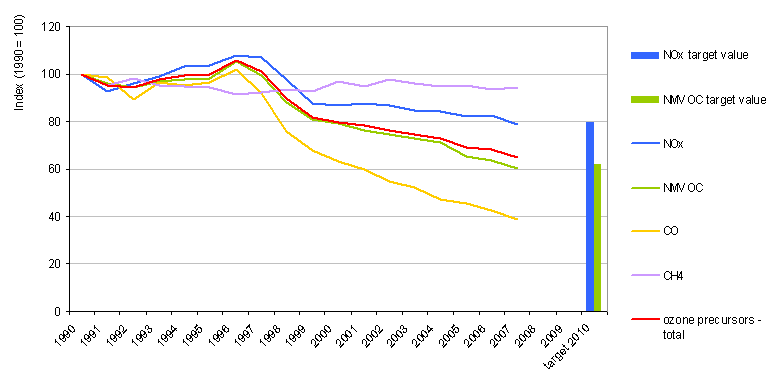
Source: Environmental Agency of the Republic of Slovenia, 2009. (Ref: Environmental Indicators in Slovenia, ZR10)
Figure 16: Structure of the emissions of ozone precursors by source of pollution in 2007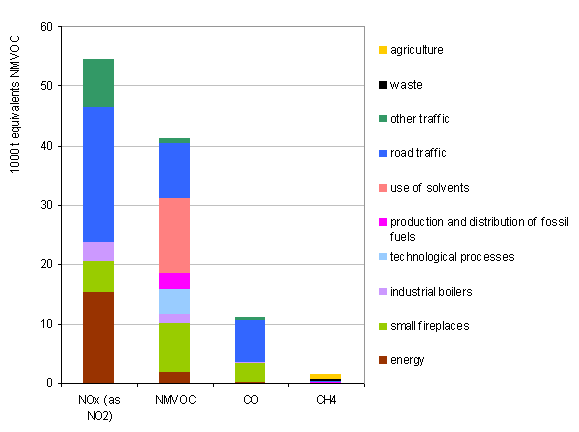
Source: Environmental Agency of the Republic of Slovenia, 2009. (Ref: Environmental Indicators in Slovenia, ZR10)
What is the 2020 outlook?
Projections of emissions of pollutants into the air by the year 2020 indicate a further reduction under the NEC Directive target. Nitrogen oxides projections are uncertain, mainly due to the impact of transit traffic, which, after Slovenia joined the EU increased dramatically.
Taking into account emissions of certain air pollutants projections of sulphur dioxide, nitrogen oxides, volatile organic compounds (VOCs), ammonia, and particulate matter emissions have been made for the period 2010-2020.
The SO2 projections point to a reduction in emissions up to 2020. Up to 2015, emissions will stay at around the same level as in 2007, but after 2015 they will fall owing to the switching of fuels in generating electricity and heat. After 2010, emissions of SO2 should no longer exceed the national ceiling set in Directive 2001/81/EC (OP TGP-1, 2009).
Projections for NOx point to a reduction in emissions up to 2020 – until 2010 emissions are due to rise relative to 2007, but after 2010 they should fall as a result of the tightening of requirements on NOx concentrations in vehicle exhaust gases. After 2015, a reduction is expected from the tightening of permitted NOx concentrations in the flue gases of large thermal power facilities the replacement of fuels in generating electricity and heat, and the continued tightening of requirements for NOx concentrations in vehicle exhaust gases. The projection of emissions from transport is very uncertain because of the influence of transit traffic that has increased markedly since Slovenia’s entry into the EU in 2004. According to the projections, in 2010 emissions of NOx should exceed the national ceiling set in Directive 2001/81/EC (OP TGP-1, 2009).
According to the projections, after 2010 VOC emissions should be below the limit value set in Directive 2001/81/EC. The reduction in emissions is a consequence of replacing old boilers running on wood biomass with new ones featuring better combustion and also the tightening of the requirements for VOC concentrations in motor vehicle exhaust gases (OP TGP-1, 2009).
Up to 2010, projections show NH3 emissions increasing owing to the increased number of animals. The lowering of emissions after that year is the result of implementing reduction measures in cattle farming, the result of the promotion of pasture husbandry (OP TGP-1, 2009).
The projections indicate a reduction in PM10 emissions after 2010. This should be the result of reduced emissions in the sectors of transformation and technological processes. Transformation emissions should fall following the tightening of legislation in 2008, and in technological processes from the closure of electrolysis B at the Talum company. The slow reduction in emissions after 2010 should be the result from fuel combustion in broad consumption and transport (MOP, 2007).
Table 1: Emission projections for 2010, 2015 and 2020
| EMISSION PROJECTIONS | |||
| Year | 2010 | 2015 | 2020 |
| Unit | kt | kt | kt |
| Oxides of sulphur (SOx expressed as SO2) | 16.3 | 17.1 | 8.6 |
| Oxides of nitrogen (NOx expressed as NO2) | 46.4 | 43.1 | 34.4 |
| Non-methane volatile organic compounds (NMVOC) | 38 | 35.74 | 33.9 |
| Ammonia (NH3) | 19.74 | 19.05 | 19.01 |
| PM10 particles | 10.15 | 9.50 | 9.32 |
Source: Ministry of the Environment and Spatial Planning, 2007 and Ministry of the Environment and Spatial Planning, 2009.
Figure 17: Course of SO2 emissions, 1990–2007, and projections with measures up to 2020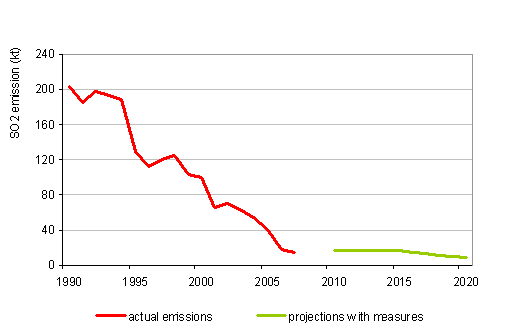
Source: Ministry of the Environment and Spatial Planning, 2009
Figure 18: Course of NOx emissions, 1990–2007, and projections with measures up to 2020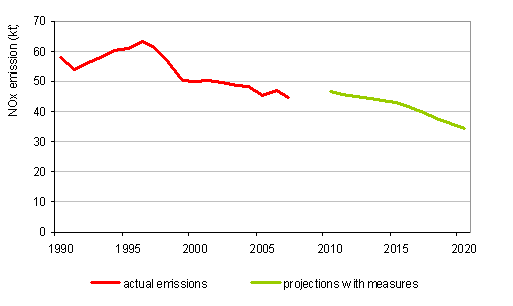
Source: Ministry of the Environment and Spatial Planning, 2009
Figure 19: Course of VOC emissions, 1990–2007, and projections with measures up to 2020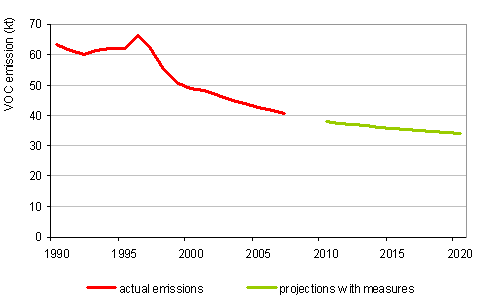
Source: Ministry of the Environment and Spatial Planning, 2009
Figure 20: Course of NH3 emissions, 1990–2007, and projections with measures up to 2020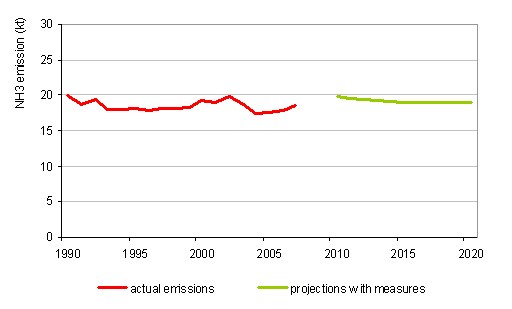
Source: Ministry of the Environment and Spatial Planning, 2009
Figure 21: Course of PM10 emissions, 1990–2007, and projections with measures up to 2020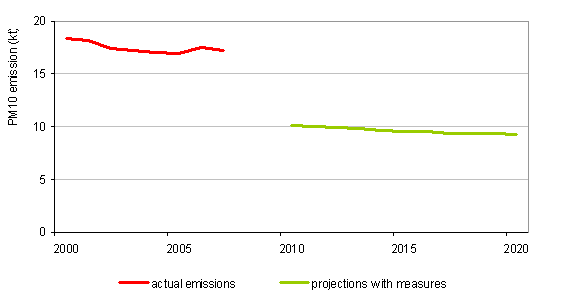
Source: Ministry of the Environment and Spatial Planning, 2007
What are the policy responses?
By adopting Operational programme for the protection of ambient air against pollution caused by particulate matter, the Government committed itself to reducing air pollution, notably by implementing measures in the transport and energy sectors. Priority actions are applied in more polluted areas (Ljubljana, Celje and Zasavje basin).
In order to improve air quality many measures have been taken. They are defined in national operational plans.
For the requirements of improving the quality of ambient air, the government adopted the following operational programmes, which are aimed at reducing emissions of pollutants into the air and at improving the quality of outside air:
- operational programme for achieving national emissions ceilings for ambient air pollutants/revision of the operational programme for achieving national emissions ceilings for ambient air pollutants from 2005 (OP NEC) (MOP, 2007);
- operational programme to reduce greenhouse gas emissions by 2012 (OP TGP-1, 2009);
- operational programme to protect ambient air from PM10 pollution (OP PM10, 2009);
- resolution on Transport Policy of the Republic of Slovenia (RePPRS, 2006);
- resolution on the National Energy Programme (ReNEP, 2004);
- in order to establish sustainable mobility, improve the quality of the environment and construct adequate infrastructure, in line with the Slovenian Development Strategy the Government adopted the Operational programme to develop the environment and transport infrastructure for the period 2007-2013 (Operativni program razvoja okoljske in prometne infrastrukture za obdobje 2007–2013, Slovenian Government, 26 July 2007).
On the local level, the majority of municipalities in areas with excessive air pollution adopted Municipal Environmental Protection Programmes, which include both national and local measures to improve air quality – for example in Ljubljana (MOL, 2007), Maribor, Trbovlje, Nova Gorica, Murska Sobota and the towns of Slovenian Istria.
Since its diffuse nature makes transport a highly unmanageable source of atmospheric pollution, various measures have been adopted with the aim of limiting it. Thus the OP PM10 (OP PM10, 2009) envisages:
- the drafting of an action plan for developing public passenger transport;
- formulation of a comprehensive strategy for managing transit goods traffic on the roads;
- introduction of carriageways intended exclusively for public passenger transport including along sections of national roads; introduction of road tolls, taking into account external costs for goods vehicles for the use of toll roads;
- introduction of environmental criteria in apportioning annual taxes for the use of vehicles on the road;
- taking the environmental aspect into account in determining the level of excise on motor fuels;
- introduction of environmental criteria in public tenders for the purchase of personal vehicles (green public procurement);
- modernisation of the railway network;
- construction of cycle lanes and support facilities and promotion of cycling.
In addition to measures on the national level, the OP PM10 (OP PM10, 2009) envisages measures that should be implemented at both the regional and local levels. In regions where the limit values for PM10 concentrations have been exceeded, there will be a need to arrange infrastructure at railway passenger stations linking the region and the urban environment. This will include arranging sufficiently large and free car parks for passengers commuting daily. The municipalities are competent for regulating road traffic and the traffic regime on local roads of urbanised parts of an area with a degraded environment. In the area of an urban environment where the limit values of PM10 have been exceeded, the following measures for local reduction of PM10 emissions need to be implemented:
- in the period of two years from the start of implementing measures to reduce PM10 emissions, a ban on the use of light and heavy goods vehicles that do not meet the set emissions standards –the emission standard will be set by an appropriate act based on analysis of the impacts, and will be adjusted to the development of technology;
- in the period of two years after the implementation of measures to reduce PM10 emissions, replacement of public passenger vehicles with vehicles that meet the requirements of the given emission standard – the emission standard will be set by an appropriate act based on analysis of the impacts, and will be adjusted to the development of technology;
- improvement of city public transport and promotion of increased use of public transport through measures such as arrangement of car parks for private vehicles at the entrance to urban areas, and incorporation of such car parks into the public road transport network;
- establishing environmental zones in Ljubljana;
- differentiated parking fees in the urban area;
- speed limits on motorways, highways and regional roads of 80 km/h,
- adequate cleaning of road surfaces in order to reduce the resuspension of particles;
- arranging separate lanes for public transport, introducing priority for public transport vehicles at crossroads, adapting the public transport network to the settlement structure, introducing intermodal transfer hubs, increasing subsidies for public transport tickets, modernising the payment system, allowing for free transfers;
- promoting non-motorised traffic through measures such as: linking up cycle route networks, establishing secure areas for bicycle storage, arranging bicycle sheds in apartment buildings, increasing pedestrian and cyclist safety, expanding the proportion of surfaces for pedestrians and cyclists;
- promoting systems of car-pooling and car-sharing to increase the occupancy of private vehicles in the urban and suburban environment.
In connection with transport it should be mentioned that Slovenia is starting to introduce biofuels, although the goals in this area lag behind the reference values in the EU Directive on biofuels or other renewable fuels for transport. Slovenia justifies variances from the reference values through the limited scope for producing biofuels (PR13).
Given the effect of polluted air on human health, especially that of children, an action plan is being drafted for the environment and children’s health. The aim of the plan is to prevent and reduce the incidence of respiratory diseases linked to the pollution of ambient and inside air among children. The plan envisages the following measures:
- ensuring areas of clean air around schools and educational institutions by limiting vehicle access, especially those with diesel engines, and by limiting sources of pollution in the vicinity –amending and implementing legislation;
- awareness raising/education of teachers, children and parents about the dangers of polluted air on health and education on preventive measures that need to be carried out on days when the pollution level is high – promoting education programmes;
- introducing regular monitoring of ambient air quality and establishing a notification system on days when the air pollution level in urban areas is high, with the aim of notifying staff at schools and educational institutions so they will know that the risk to health is high – amending and implementing legislation, monitoring exposure to chemical substances in the environment;
- involvement of children, schools and local communities in spreading information about the importance of clean air for human health – promoting the active participation of involved people, children, educators and health workers.
In view of the increasing concern of citizens over environmental problems, and in order to make habits and practices in the environment friendlier, the subject of environmental education has also been incorporated into the school curriculum. In connection with air pollution and in turn with associated sectoral issues such as transport, energy, health, etc. mention should be made of eco-schools and the UNESCO schools, which are actively involved in issues relating to the atmosphere. Another important factor in providing environmental education is the education of teachers, so the Ministry of Education and Sport is giving this special attention as part of the yearly range of seminars offered for continuing professional enhancement. Furthermore, the Slovenian Board of Education is publishing the magazine Environmental Education in Schools (Okoljska vzgoja v šoli).